Data Engineering With Dagster Part Eight: Metadata

Metadata in Dagster: The Two Worlds
Metadata is data about data - and while that sounds meta (and it is), it’s also the secret to making your pipelines understandable, traceable, and collaborative.
Imagine you're running a bakery:
- The cookies = your data
- The label saying “baked today at 7:32am, by Sam” = your metadata
In Dagster, metadata powers both visibility and observability. There are two types you’ll work with:
- Definition metadata → fixed context like descriptions and groupings
- Materialization metadata → dynamic info like row counts, timestamps, or even rendered charts from each run
We’ll explore both, starting with how to better describe your data for your team - and future you.
Definition Metadata: Describe Your Assets
Dagster gives you two clean ways to document your assets:
Option 1: Python Docstrings
Add a triple-quoted string at the top of your asset function - Dagster will pick it up:
@dg.asset
def taxi_zones_file() -> None:
    """
    The raw CSV file for the taxi zones dataset. Sourced from the NYC Open Data portal.
    """
These show up in the Dagster UI - perfect for quick inline docs.
Option 2: The description= Parameter
You can also add a description directly in the decorator:
@dg.asset(
    description="The raw CSV file for the taxi zones dataset. Sourced from the NYC Open Data portal."
)
def taxi_zones_file() -> None:
    """This docstring won’t be shown in the UI."""
If both exist, Dagster uses the description=. Handy if you want internal vs. external descriptions.
Where You See It
- In the Assets tab under the asset name
- In the Global Asset Lineage graph, when you hover over a node
Documentation becomes part of your code - and your UI.
Grouping Assets: Don’t Let It Get Messy
As your project grows, your assets multiply. It’s time to group them - not just visually, but functionally.
You can group assets:
- Individually using the
group_name=parameter - By module, using
load_assets_from_modules(..., group_name=...)
Both result in clearly labeled boxes in the Dagster UI - and more maintainable job selection.
Grouping Individual Assets
@dg.asset(group_name="raw_files")
def taxi_zones_file() -> None:
    ...
@dg.asset(group_name="ingested")
def taxi_trips() -> None:
    ...
Grouping Entire Modules
In definitions.py:
metric_assets = dg.load_assets_from_modules(
    modules=[metrics],
    group_name="metrics"
)
This is clean, scalable, and ideal for large projects.
Mini Excursus: Practice Grouping
Try it like this:
# assets/trips.py
@dg.asset(group_name="raw_files")
def taxi_trips_file() -> None:
    ...

@dg.asset(group_name="ingested")
def taxi_trips() -> None:
    ...
# definitions.py
request_assets = dg.load_assets_from_modules(
    modules=[requests],
    group_name="requests"
)
Now, in the UI, assets are visually separated into raw_files, ingested, and requests.
No more asset soup. Just order.
Materialization Metadata: Add Context to Each Run
While definition metadata is about what the asset is, materialization metadata is about what happened during a run.
This might include:
- Number of records processed
- Size of output files
- Execution timestamps
- Even preview charts or markdown
Let’s implement a common one: row count.
Adding Row Count to taxi_trips_file
In assets/trips.py:
import pandas as pd
import dagster as dg

@dg.asset(
    partitions_def=monthly_partition,
    group_name="raw_files",
)
def taxi_trips_file(context) -> dg.MaterializeResult:
    """
    The raw parquet files for the taxi trips dataset. Sourced from the NYC Open Data portal.
    """
    partition_date_str = context.partition_key
    month_to_fetch = partition_date_str[:-3]

    raw_trips = requests.get(
        f"https://d37ci6vzurychx.cloudfront.net/trip-data/yellow_tripdata_{month_to_fetch}.parquet"
    )

    file_path = constants.TAXI_TRIPS_TEMPLATE_FILE_PATH.format(month_to_fetch)

    with open(file_path, "wb") as output_file:
        output_file.write(raw_trips.content)

    num_rows = len(pd.read_parquet(file_path))

    return dg.MaterializeResult(
        metadata={
            "Number of records": dg.MetadataValue.int(num_rows)
        }
    )
Mini Excursus: Do It for taxi_zones_file
@dg.asset(group_name="raw_files")
def taxi_zones_file() -> dg.MaterializeResult:
    raw_taxi_zones = requests.get(
        "https://community-engineering-artifacts.s3.us-west-2.amazonaws.com/dagster-university/data/taxi_zones.csv"
    )

    with open(constants.TAXI_ZONES_FILE_PATH, "wb") as output_file:
        output_file.write(raw_taxi_zones.content)

    num_rows = len(pd.read_csv(constants.TAXI_ZONES_FILE_PATH))

    return dg.MaterializeResult(
        metadata={
            "Number of records": dg.MetadataValue.int(num_rows)
        }
    )
Viewing in the UI
Once materialized:
- Open Global Asset Lineage
- Select
taxi_trips_file - View row count per partition as a graph
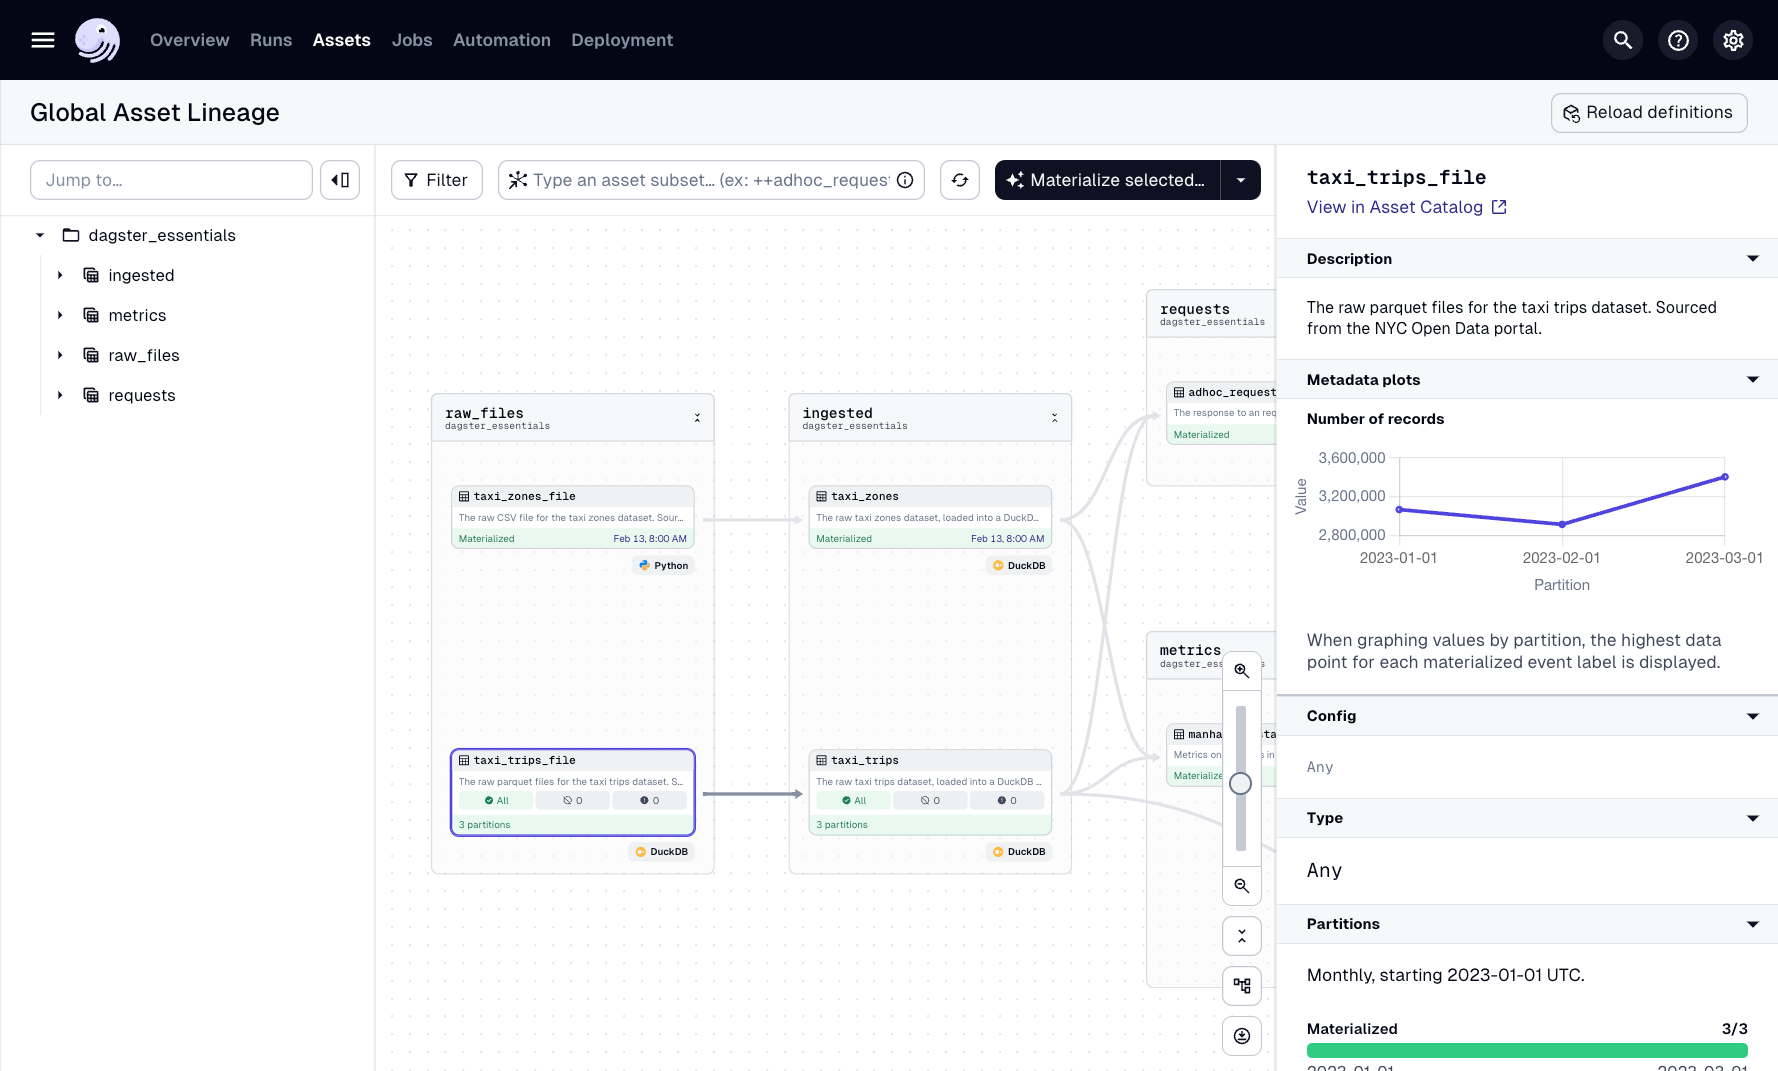
Real-time dashboards. Zero setup.
Markdown Metadata: Inline Chart Previews
Some metadata is visual.
Let’s embed a generated chart (e.g. from adhoc_request) as a rendered Markdown image in the UI.
Here’s how:
import base64
with open(file_path, "rb") as file:
image_data = file.read()
base64_data = base64.b64encode(image_data).decode('utf-8')
md_content = f""
return dg.MaterializeResult(
metadata={
"preview": dg.MetadataValue.md(md_content)
}
)
Dagster renders it directly in the UI:
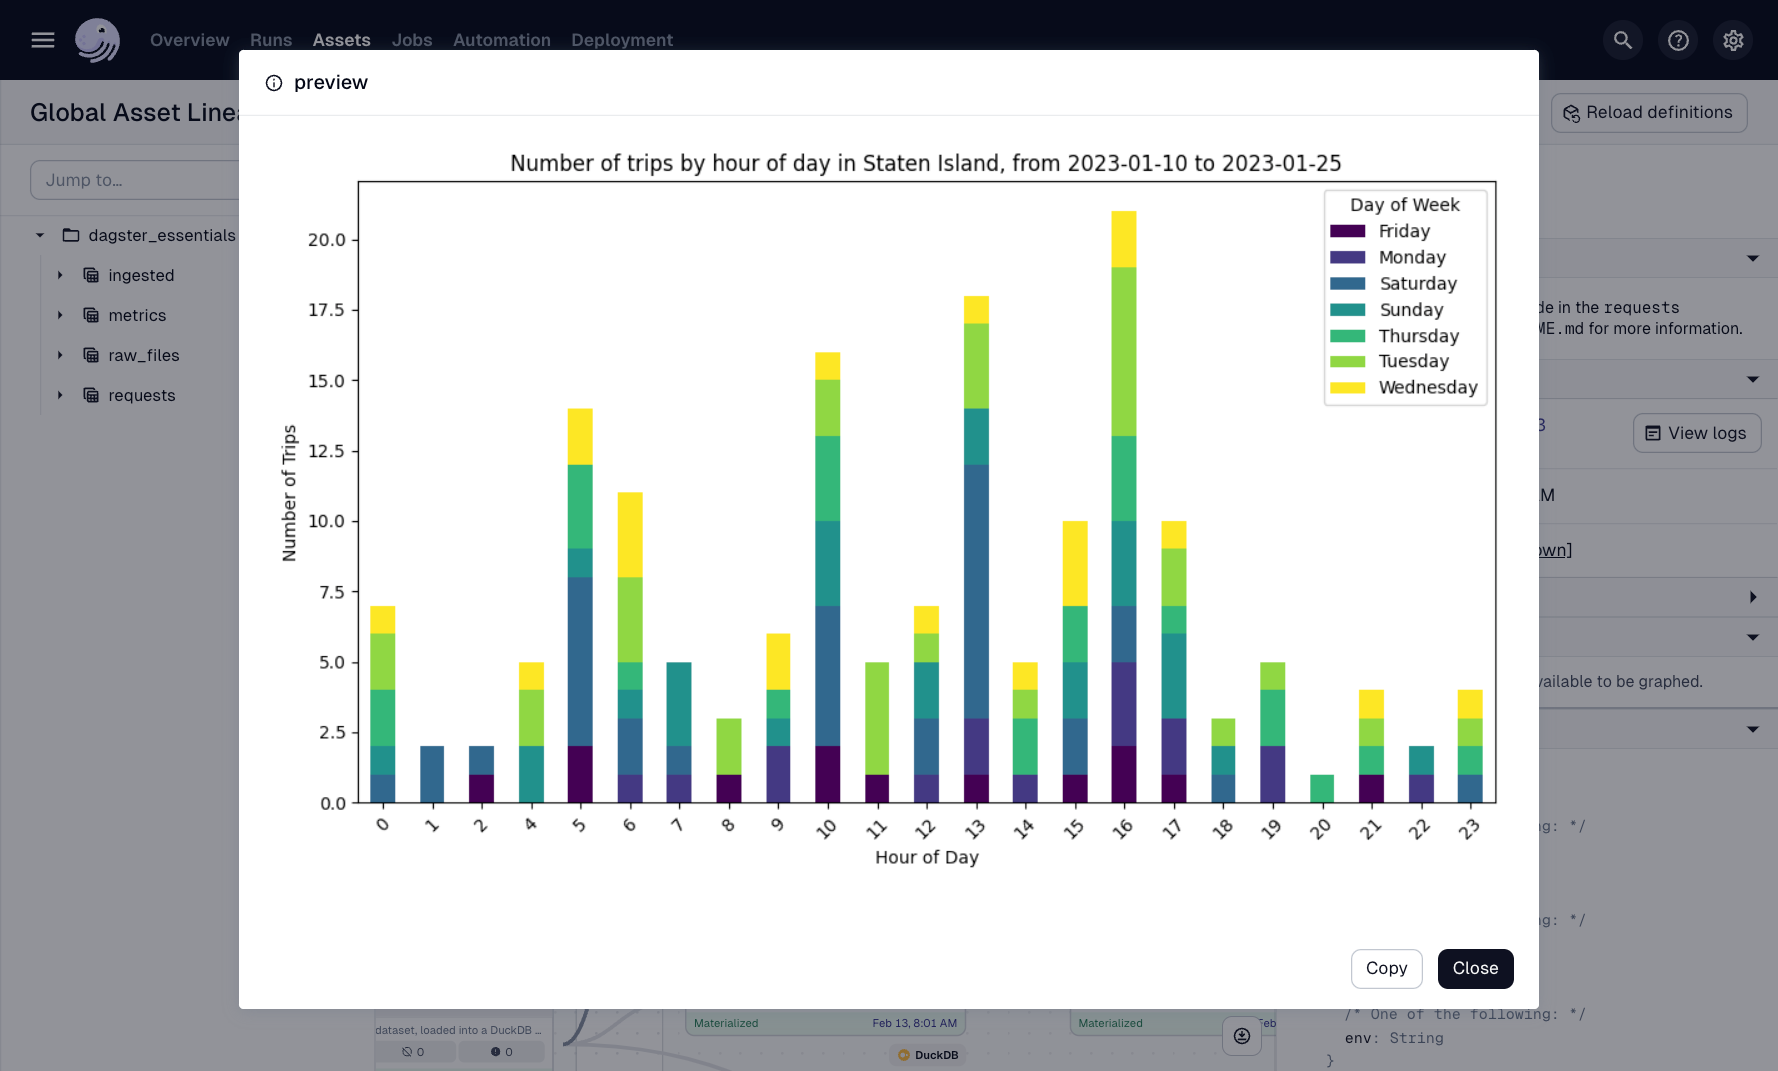
It’s like adding screenshots to your pipeline logs - but built in.
Knowledge Check
Subscribe to continue reading